How To Reduce Bunker Spend Of Your Ships
Bunker fuel is the single largest variable cost in ship operations, accounting for 50–80% of a voyage’s total expense. Unlike terminal handling charges or port dues, fuel spend is not a fixed function of cargo volumes—it responds directly to operational decisions made on the bridge, in the engine room, and at the procurement desk. That elasticity makes it the prime target for cost reduction in any maritime business.
Bunker prices are also notoriously volatile, lurching with geopolitical tensions, OPEC decisions, and regulatory shifts. Companies that lack a systematic approach to bunker management are permanently exposed to that volatility. Those that do have a system consistently outperform peers on operating margin, regardless of where the market is heading.
This guide covers nine actionable strategies—from engineering choices to procurement tactics—that maritime operators can deploy to reduce bunker spend without compromising vessel performance or regulatory compliance.
Why Bunker Spend Demands Constant Attention
Container carriers, tanker operators, and bulk shipping companies all share one structural reality: a cargo ship on a long-haul route can consume 100–300 metric tonnes of fuel per day. At current VLSFO prices in major bunkering hubs, that translates to daily fuel costs of $60,000–$180,000 per vessel. Across a fleet of twenty ships, even a 5% reduction in consumption saves millions of dollars annually.
The introduction of IMO sulphur regulations pushed operators toward Very Low Sulphur Fuel Oil (VLSFO), which commands a significant price premium over Heavy Fuel Oil (HFO). This regulatory shift has amplified the financial impact of every inefficiency in fuel management and made optimization more valuable than ever.
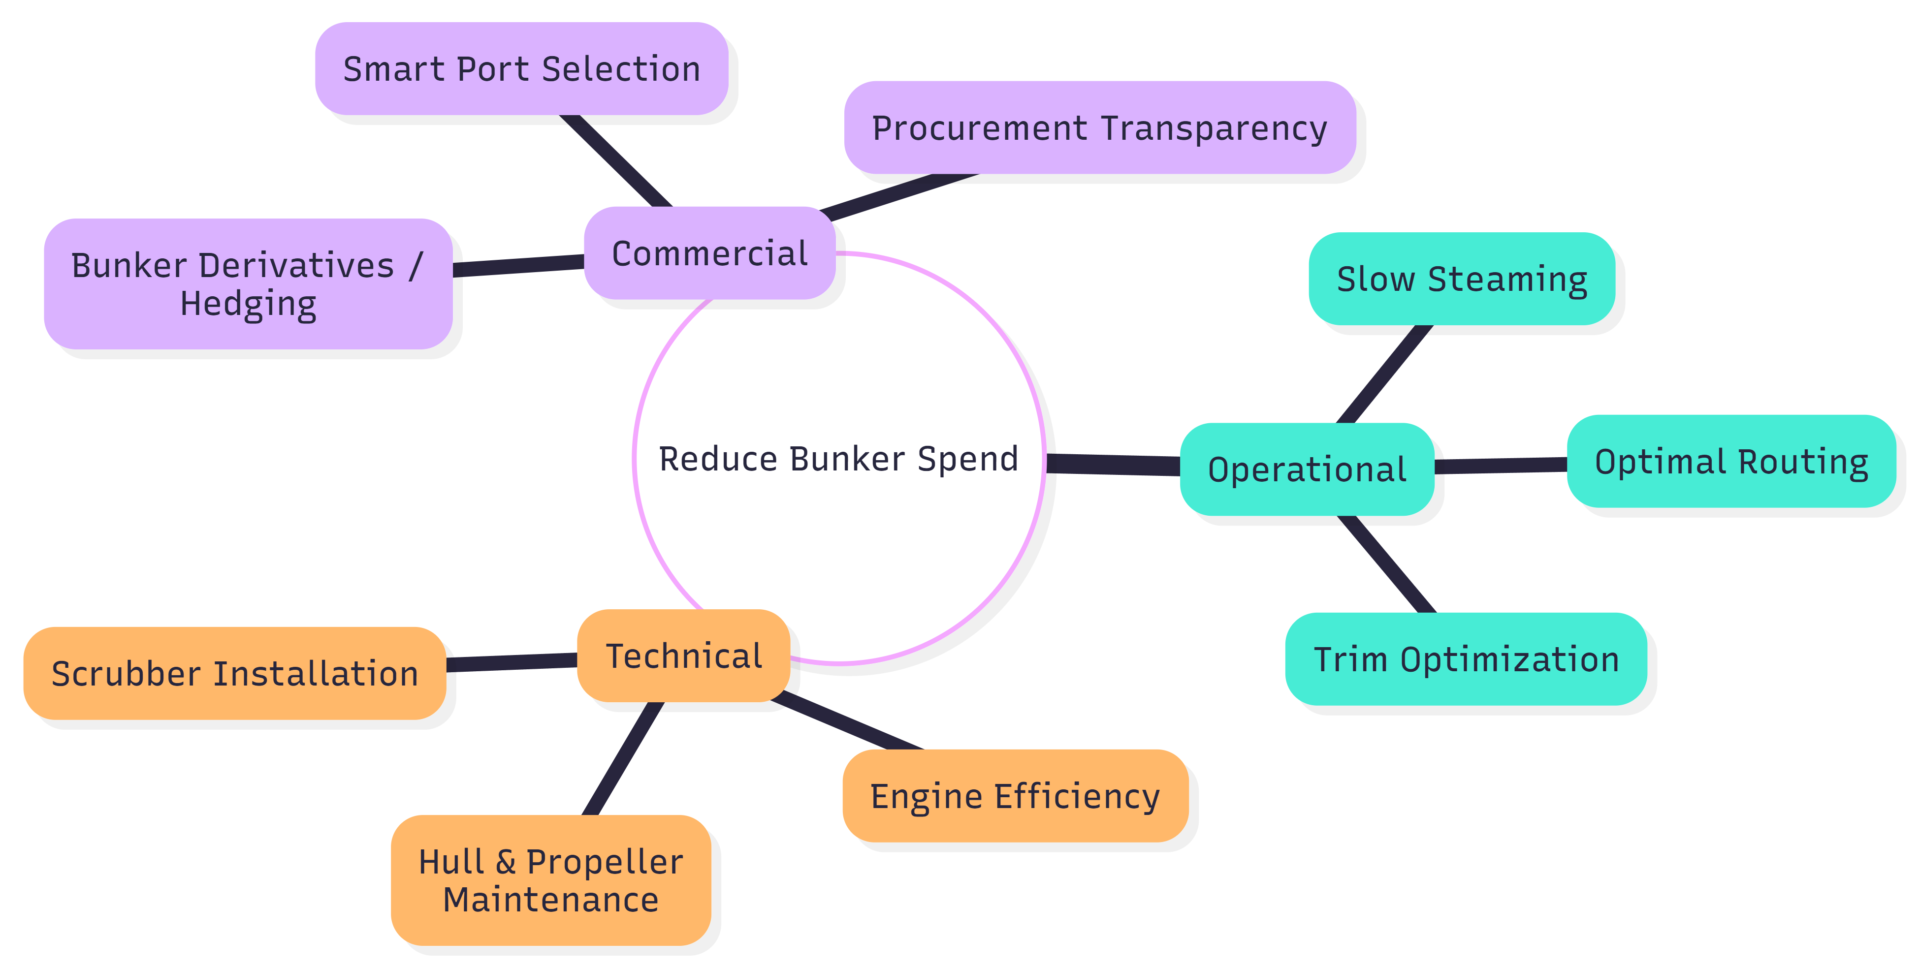
The 9 Strategies to Reduce Bunker Spend
1. Slow Steaming and Super-Slow Steaming
Slow steaming is the single most powerful lever for cutting fuel consumption. The relationship between speed and fuel burn is not linear—it follows a cubic power law. This means that a relatively small reduction in speed produces a disproportionately large reduction in fuel consumption.
At the practical level: reducing speed from 27 knots to 18 knots cuts fuel consumption by approximately 59%. Reducing further to “super-slow steaming” speeds below 18 knots produces additional savings, though diminishing returns begin to appear and voyage time increases significantly.
| Speed (knots) | Relative Fuel Consumption | Approx. Saving vs. 27 knots | Classification |
|---|---|---|---|
| 27 | 100% | — | Design Speed |
| 24 | ~70% | ~30% | Normal Service Speed |
| 20 | ~50% | ~50% | Slow Steaming |
| 18 | ~41% | ~59% | Slow Steaming |
| <18 | <41% | >59% | Super-Slow Steaming |
Carriers apply slow steaming selectively based on commercial logic. On head-haul routes—typically laden voyages from Asian manufacturing hubs to European or North American consumption markets—speed matters more because cargo is time-sensitive and freight rates are higher. On backhaul legs, where vessels carry fewer containers or reposition empties, slow steaming is the obvious default.
Slow steaming also has the secondary benefit of absorbing excess fleet capacity. When more days are required per voyage, more vessels are needed to maintain weekly service schedules, which reduces idle tonnage and supports utilisation rates across the industry. The environmental benefit—lower GHG emissions—is an added compliance advantage as IMO carbon intensity regulations tighten.
2. Hull and Propeller Maintenance
Marine biofouling—the accumulation of algae, barnacles, and other organisms on a ship’s hull—increases hydrodynamic resistance. Studies consistently show that heavy fouling can increase fuel consumption by 20–40% compared to a clean hull. Regular hull cleaning and anti-fouling coating application are therefore among the highest-return maintenance investments available.
Propeller polishing is equally impactful. A rough or slightly damaged propeller surface creates turbulence that reduces propulsive efficiency. Propeller polishing at each drydocking, and underwater polishing where conditions allow, typically yields fuel savings of 3–8%.
| Maintenance Activity | Estimated Fuel Saving | Frequency | Approximate Cost |
|---|---|---|---|
| Full Hull Cleaning & Anti-fouling Paint | 10–40% | Every 2.5–5 years (drydock) | $500,000–$1,500,000+ |
| Underwater Hull Cleaning (UWILD) | 3–10% | Every 6–18 months | $20,000–$80,000 |
| Propeller Polishing | 3–8% | At drydock / as needed | $5,000–$30,000 |
| Advanced Silicone Anti-fouling Coating | Up to 5% additional | At drydock application | Premium ~$100,000–$300,000 extra |
3. Optimized Weather Routing
The route a vessel takes is rarely determined by distance alone. Sailing into a 30-knot headwind or against a strong ocean current forces the engine to work harder, consuming substantially more fuel to maintain the same speed. Modern weather routing systems integrate real-time meteorological data, ocean current charts, and wave height forecasts to compute the most fuel-efficient passage—not merely the shortest one.
Beyond fuel savings, weather routing reduces stress on the hull and cargo, lowers the risk of weather-related delays, and improves arrival time predictability—which matters increasingly as just-in-time (JIT) port arrivals become standard practice.
JIT arrivals deserve specific mention. Vessels that steam at full speed only to wait at anchorage for a berth window are burning fuel pointlessly. Port-integrated systems—such as PSA’s Opt-E-Arrival platform—allow vessels to calculate their optimum arrival speed in coordination with port berth scheduling, eliminating unnecessary idle steaming. Estimated fuel savings from JIT approaches range from 4–7% per port call.
4. Trim and Draft Optimization
A vessel’s trim—the difference in draft between bow and stern—significantly affects its resistance through the water. Operating at non-optimal trim can increase fuel consumption by 1–2%, which compounds quickly across a full year of voyages.
Modern trim optimization software, available from vendors including NAPA, Eniram (now Wartsila), and Ulstein, calculates the optimal ballast distribution for the vessel’s current loading condition, route, and speed. The investment is modest—typically $50,000–$200,000 for a software solution—and the payback period on a single large vessel is often under one year.
5. Main Engine and Auxiliary Machinery Efficiency
A well-maintained main engine running at peak thermal efficiency consumes significantly less fuel than one that is fouled, maladjusted, or operating with worn components. Key maintenance priorities include:
- Regular cylinder liner and piston ring inspections
- Fuel injector calibration and replacement on schedule
- Turbocharger cleaning and maintenance
- Exhaust valve timing checks
- Purifier (centrifuge) maintenance to ensure clean fuel delivery
Auxiliary engines are often overlooked but contribute meaningfully to overall fuel spend. In port, auxiliary engines power lighting, HVAC, cargo handling equipment, and hotel services. Implementing a structured policy to shut down non-essential generators and machinery during port stays—requiring active coordination between deck and engine officers—can reduce auxiliary fuel consumption by 10–20% during port time.
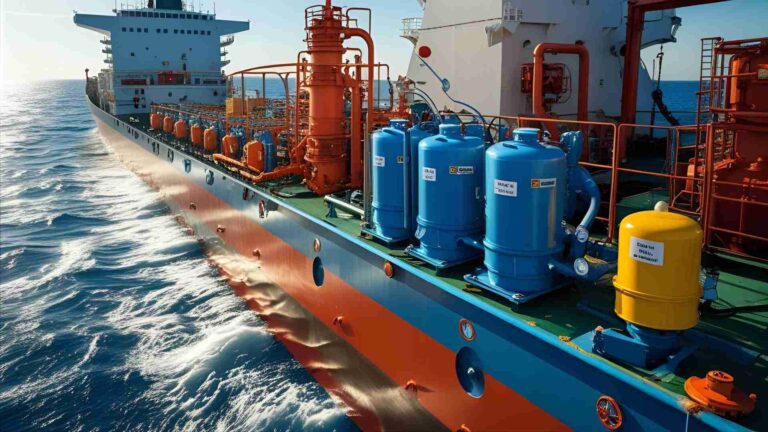
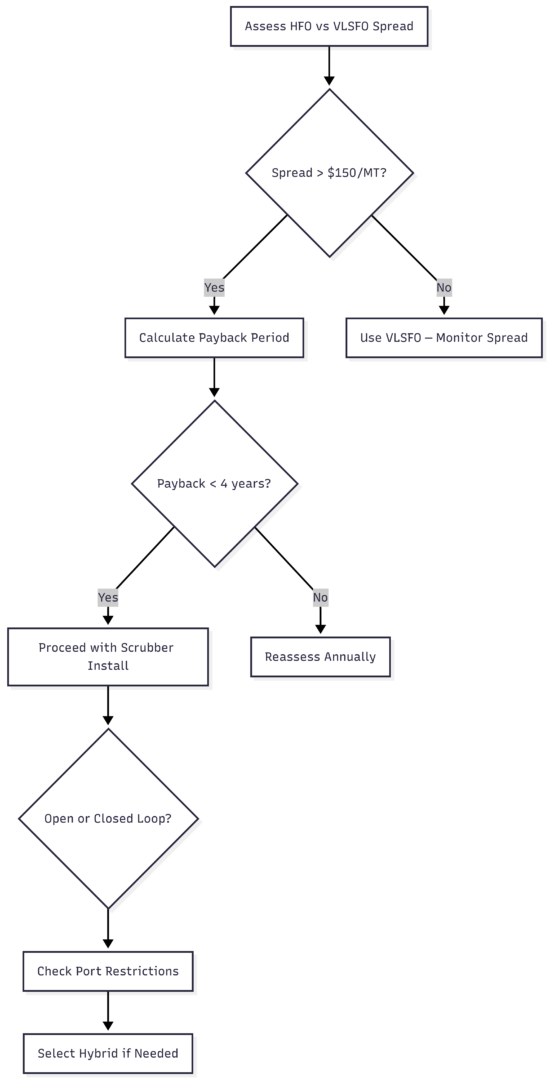
6. Scrubber Installation
IMO sulphur regulations require ships to use fuel with a maximum sulphur content of 0.5% globally (0.1% in Emission Control Areas). Compliance can be achieved either by switching to VLSFO or by installing exhaust gas cleaning systems—commonly called scrubbers—that allow continued use of cheaper HFO.
The economic case for scrubbers depends on the price spread between HFO and VLSFO. When that spread is wide, scrubbers pay back quickly.
| Parameter | Typical Value / Range |
|---|---|
| Installation cost (newbuild) | ~$2,000,000 per vessel |
| Installation cost (retrofit) | $3,000,000–$6,000,000 per vessel |
| HFO vs. VLSFO spread (indicative) | $150–$350+ per metric tonne |
| Typical payback period | 2–4 years (varies with spread) |
| Scrubber type | Open-loop, Closed-loop, or Hybrid |
| Regulatory consideration | Open-loop scrubbers banned in some ports/ECAs |
It is important to note that open-loop scrubbers, which discharge wash water directly into the sea, are increasingly restricted in specific ports and regions. Operators investing in scrubbers should evaluate hybrid or closed-loop systems for maximum geographic flexibility.
7. Bunker Procurement: Using Intermediaries, Market Coverage, and Derivatives
Operational efficiency reduces how much fuel a ship burns. Procurement efficiency determines what you pay per tonne. Both matter equally.
Market coverage: Many operators default to a small roster of familiar suppliers. While comfortable, this approach sacrifices competitive tension. Covering a broader set of vetted, reputable suppliers—through a broker or digital platform—almost always yields lower prices. Independent data suggests that competitive tendering across five or more suppliers consistently produces better prices than sole-supplier relationships.
Using intermediaries: Quality brokers and digital bunker procurement platforms provide more than price discovery. They supply supplier vetting, claim history tracking, and advisory intelligence on when and where to buy. Their fee is typically offset many times over by the savings generated. Platforms like BunkerEx have further increased transparency by publishing fixed, visible supplier fees, eliminating hidden commission layers.
Accounting for total landed cost: The headline price per metric tonne is rarely the full cost. Barge fees, port calling costs, surveyor fees, and delivery charges can add $10–$50 per metric tonne. Procurement decisions should always be based on total delivered cost, not list price, factoring in any deviation from the planned route required to reach the bunkering port.
Bunker derivatives and hedging: For larger operators, bunker futures and swaps provide a mechanism to lock in prices for future requirements, protecting cash flow against upward price spikes. The derivatives market for marine fuels is well-developed in Singapore and Rotterdam. While hedging is more common among airlines (which hedge up to 60% of fuel needs), shipping companies with predictable voyage schedules can deploy similar strategies effectively. Contracts listed on the Chicago Mercantile Exchange and other exchanges cover key grades and delivery locations.
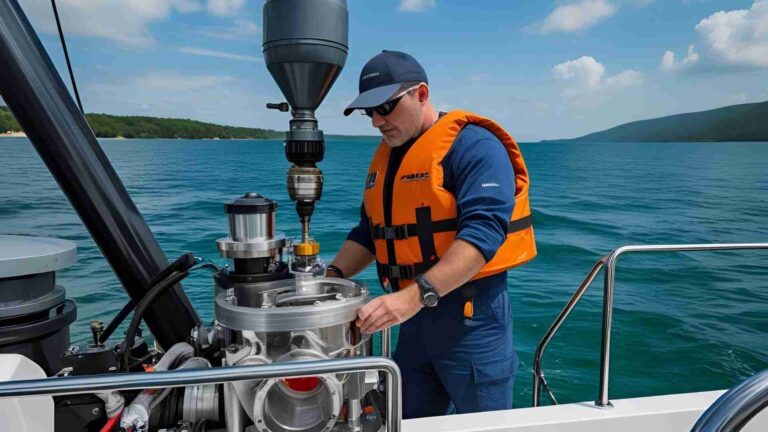
Fraud prevention: Bunker fraud is a persistent industry problem. Malpractices include adulteration, short delivery, and specification falsification. Given that even a small percentage of the fuel quantity misrepresented on a large stem represents significant value, operators must implement independent surveying, Coriolis flow meters for quantity verification, and robust procurement policies with segregation of duties.
8. Strategic Bunkering Port Selection
Bunker prices vary substantially between ports—even within the same region. Singapore, Rotterdam, Fujairah, Hong Kong, and Panama are the world’s primary bunkering hubs, but prices at secondary ports can occasionally be materially cheaper due to local supply conditions, government policy, or competitive dynamics.
| Port | Region Served | Annual Bunker Volume (approx.) | Key Fuel Grades Available |
|---|---|---|---|
| Singapore | Asia-Pacific, Indian Ocean | ~50 million MT/year | VLSFO, HFO, MGO, LNG |
| Rotterdam | Northwest Europe, Baltic | ~10–12 million MT/year | VLSFO, HFO, MGO, LNG, Methanol |
| Fujairah (UAE) | Middle East, Indian Ocean | ~8–10 million MT/year | VLSFO, HFO, MGO |
| Hong Kong | Northeast Asia | ~4–5 million MT/year | VLSFO, MGO |
| Panama | Americas, Canal Transit | ~3–4 million MT/year | VLSFO, MGO |
Operators should build bunkering decisions into voyage planning—not treat them as an afterthought. A deviation of 50 nautical miles to reach a cheaper port can be justified when the price differential exceeds the fuel cost of the deviation. Routing optimization software can calculate this trade-off automatically.
9. Performance Monitoring, Reporting, and Analytics
Modern vessels transmit continuous operational data via satellite connectivity. Speed, rpm, fuel flow rates, weather conditions, engine parameters, and cargo weight are all available in near real-time. This data is only valuable if it is acted upon.
Effective bunker spend management requires a structured process for comparing actual consumption against the pre-voyage estimate (the “speed/consumption certificate” projection), investigating deviations above a defined threshold, benchmarking fleet performance against sister vessels, and tracking trends over time to identify deteriorating machinery or hull condition.
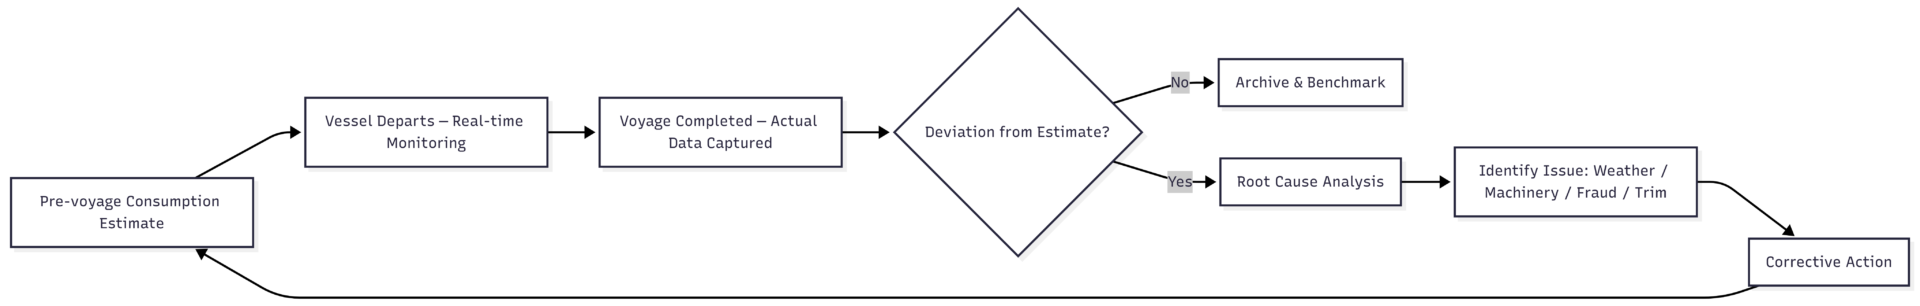
Unexplained deviations in fuel consumption are also a key indicator of potential fraud or unauthorized fuel transfer. A robust monitoring system is therefore both a performance management tool and a control mechanism.
Putting It Together: A Prioritization Framework
Not every strategy is equally applicable to every vessel or operator. The table below provides a quick-reference guide to implementation priority based on vessel type and cost impact.
| Strategy | Typical Fuel Saving | Implementation Cost | Best Suited For | Payback Period |
|---|---|---|---|---|
| Slow Steaming | 20–59% | Minimal (operational) | All vessel types | Immediate |
| Hull Cleaning & Anti-fouling | 10–40% | $20,000–$1,500,000 | All vessel types | Months |
| Propeller Polishing | 3–8% | $5,000–$30,000 | All vessel types | <1 year |
| Weather Routing / JIT | 2–10% | $50,000–$200,000 (software) | All vessel types | <1 year |
| Trim Optimization | 1–2% | $50,000–$200,000 | All vessel types | ~1 year |
| Engine & Aux Maintenance | 3–10% | Routine maintenance budget | All vessel types | Immediate |
| Scrubber Installation | Depends on spread | $2,000,000–$6,000,000 | High-consumption vessels | 2–4 years |
| Procurement Optimization | 2–8% on price | Broker/platform fee | All operators | Immediate |
| Bunker Derivatives | Risk management | Margining costs | Large operators | N/A (risk tool) |
| Performance Monitoring | Enables all other savings | $30,000–$150,000/year (systems) | All fleets | <1 year |
Conclusion
Bunker spend reduction is not a single initiative—it is a continuous discipline that spans engineering, operations, procurement, and data management. The strategies above are not mutually exclusive. The most fuel-efficient operators stack them: they slow steam on backhaul legs, maintain clean hulls, route around bad weather, use JIT port arrivals, monitor consumption daily, and buy fuel competitively from a wide supplier base.
The financial case is compelling at any bunker price level. When prices are high, the absolute dollar savings from each percentage point of efficiency improvement are large. When prices are low, operators who have embedded efficient practices enjoy structural cost advantages over competitors who have not. Either way, disciplined bunker management is one of the most durable sources of competitive advantage available to maritime operators.
Happy Boating!
Share How To Reduce Bunker Spend Of Your Ships with your friends and leave a comment below with your thoughts.
Read Blackwater Treatment Onboard Cruise Ships Explained until we meet in the next article.